How to Analyze Sales Performance: Key Metrics and Steps


Casey O'Connor
Sales performance analysis is one of the most important keys to success for sales teams that want to grow and scale.
Sales teams that don’t know how to analyze sales performance will be unable to understand what exactly is and isn’t working. This knowledge allows teams to make the necessary changes in order to see their desired results. Sales performance gives your team actionable insights for continuous improvement.
Sales teams should make it a priority to analyze individual and team sales performance over time, and compare that data to set quotas, sales targets, and organization goals. This process needs to be data-driven, standardized, and routine in order for it to be effective.
Sales teams that analyze their sales performance the right way enjoy a number of benefits:
- Boosted revenue and profits
- Improved customer satisfaction
- A better understanding of market trends
- An overall more effective decision-making process
Fortunately, there are many practical strategies and sales tools that can help teams optimize how they analyze their sales performance.
In this article, we’ll go over everything you need to know about how to analyze sales performance, including key metrics to track, tools and techniques for performance analysis, and some common challenges to prepare for.
Here’s what we’ll cover:
- What Is Sales Performance Analysis?
- Key Metrics to Track in Sales Performance
- Tools and Techniques for Sales Performance Analysis
- Steps to Conduct a Comprehensive Sales Performance Analysis
- Common Challenges in Sales Performance Analysis
What Is Sales Performance Analysis?
Sales performance analysis is the process of collecting, monitoring, and evaluating sales data about specific parts of the sales process and then using those insights to drive sales strategies.
Sales teams rely on sales performance analysis to compare their team’s results to their own goals, as well as against industry benchmarks. It helps reps and teams understand which parts of the process they’re reliably great at, and which parts they need to fine-tune.
Sales performance analysis can also help sales teams develop a better understanding of the pain points, challenges, and needs of the target market.
For example, sales analytics can help teams improve the accuracy of their ideal customer profile (ICP) and buyer personas. 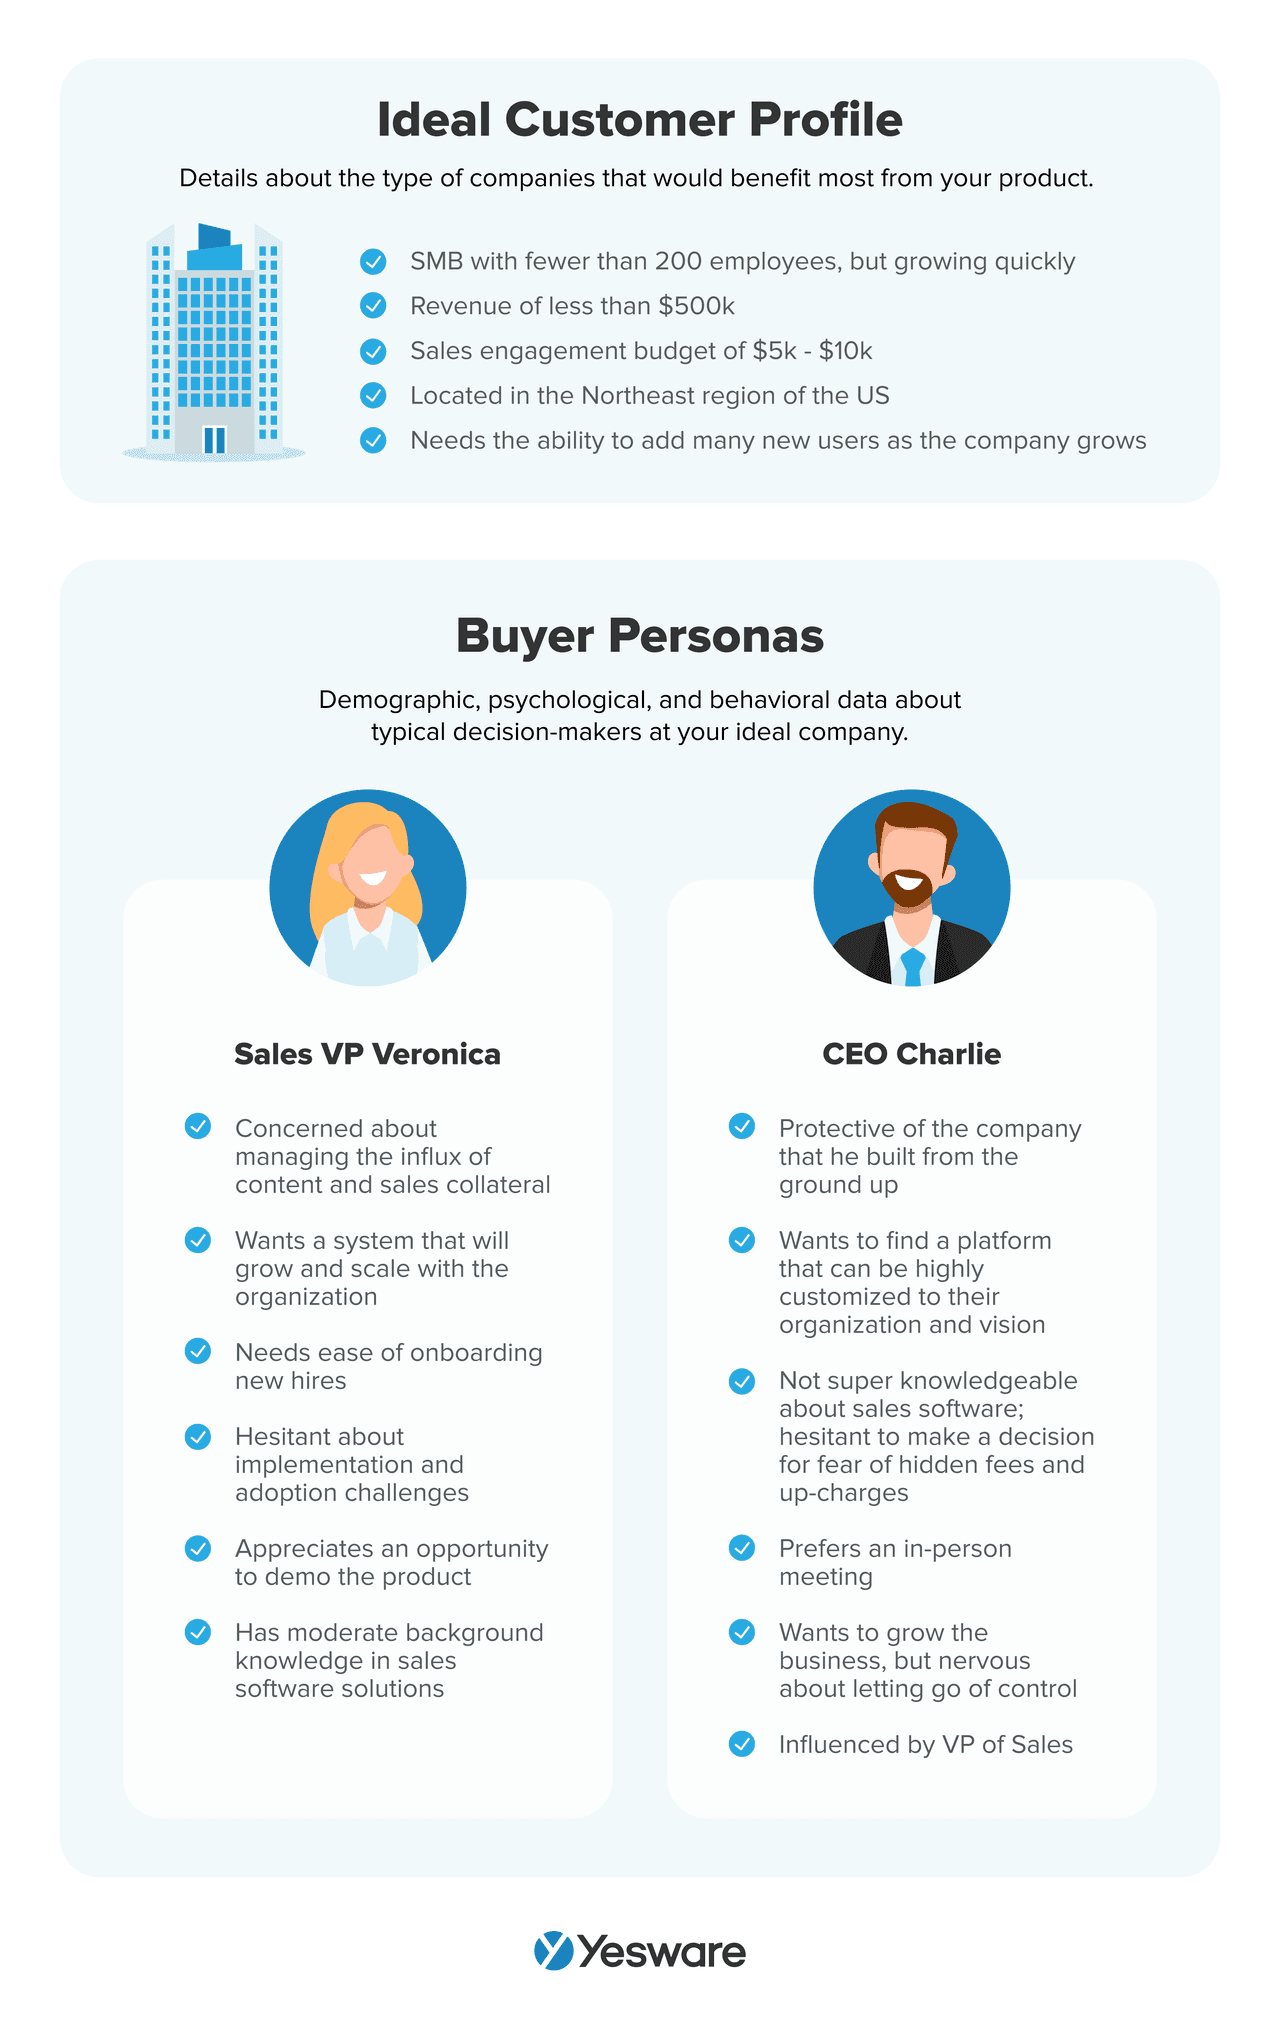 The process is also beneficial for the C-suite, as effective sales performance analysis can help executives better understand their brand’s position and potential profitability in the overall market, give better insight into revenue values and other sales figures, and help identify opportunities for market expansion and scaling.
Overall, sales teams that know how to analyze sales performance are able to strategize more effectively and work their pipeline more efficiently (among other major benefits).
Sales teams that use data to make decisions and gain insight into their performance are more likely to succeed and enjoy scalable growth.
Key Metrics to Track in Sales Performance
Sales teams that want to analyze sales performance should start with the following metrics.
Even teams that are well-versed in data analysis should revisit their processes to ensure that they’re tracking and analyzing the following crucial sales metrics. 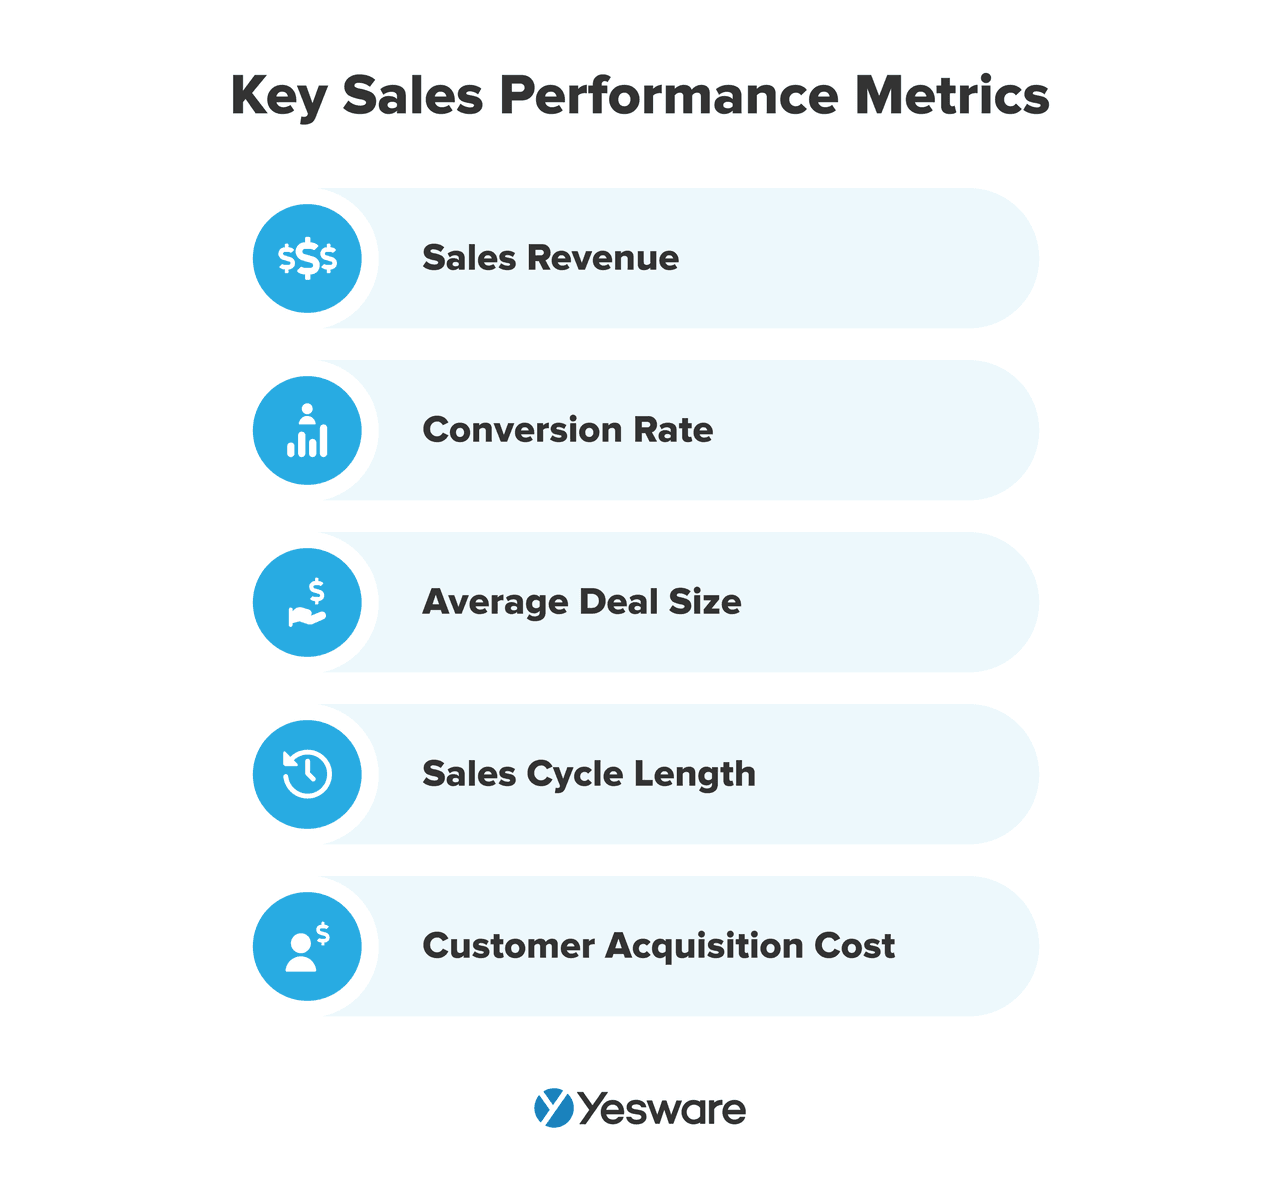
Sales Revenue
Tracking sales revenue is relatively straightforward, but it’s so important that it’s well worth mentioning at the top of the list.
Total sales revenue is defined as the amount of revenue made from sales over a specific period of time.
Some sales teams also track revenue growth (also known as sales growth) carefully. 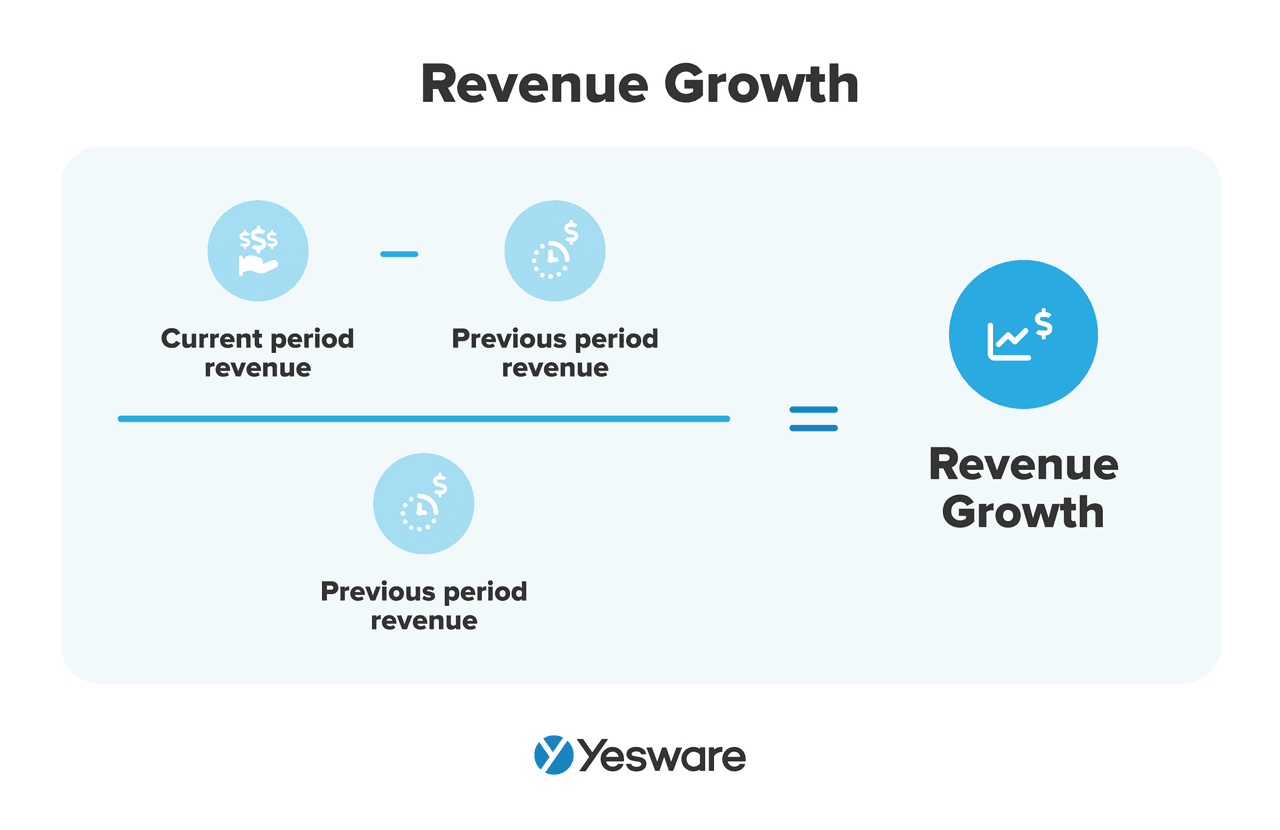 Tracking revenue growth helps teams analyze revenue trends over time. Sales teams typically track revenue monthly, quarterly, and/or yearly.
Conversion Rates
There are several ways to define a conversion rate in sales, and the specific ones your team tracks and analyzes will depend on your organization’s goals.
Overall conversion rate is the percentage of leads your team successfully converts into closed-won deals. 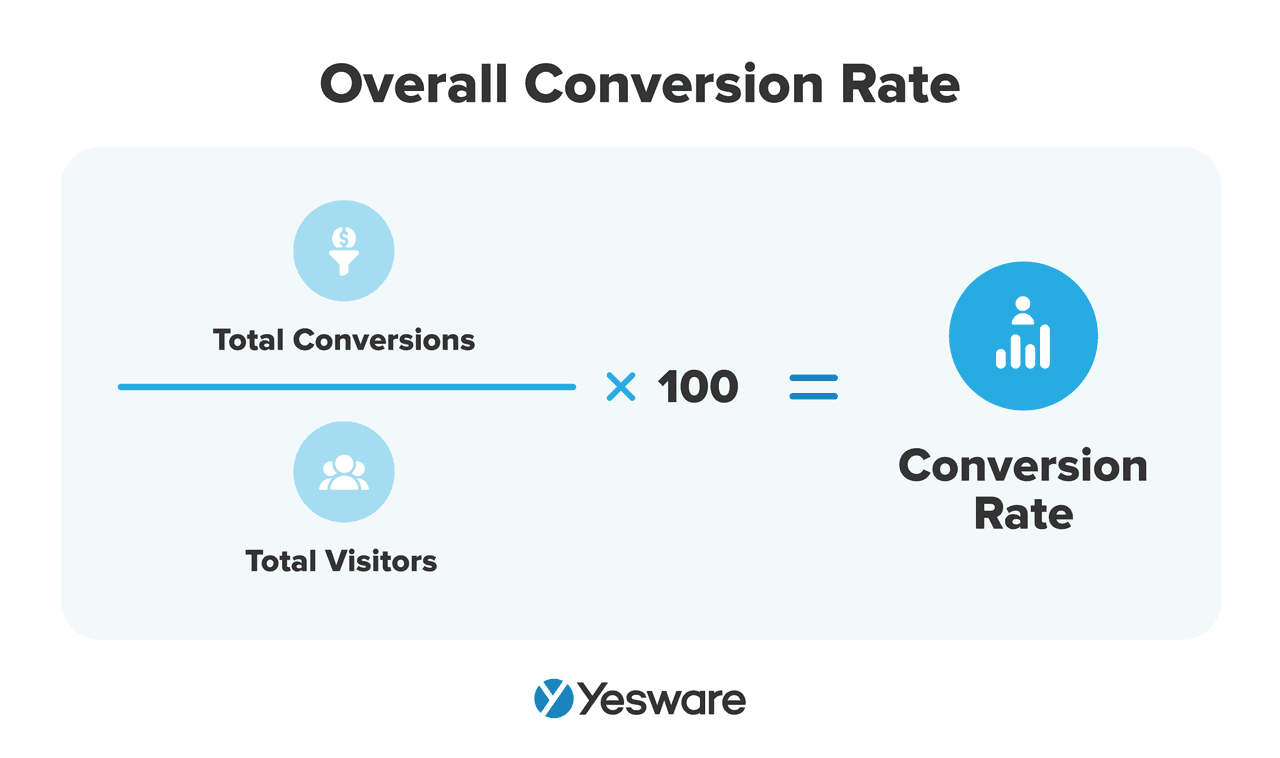 Some sales teams also analyze their conversion rate by sales funnel stage.
That formula looks a bit different: 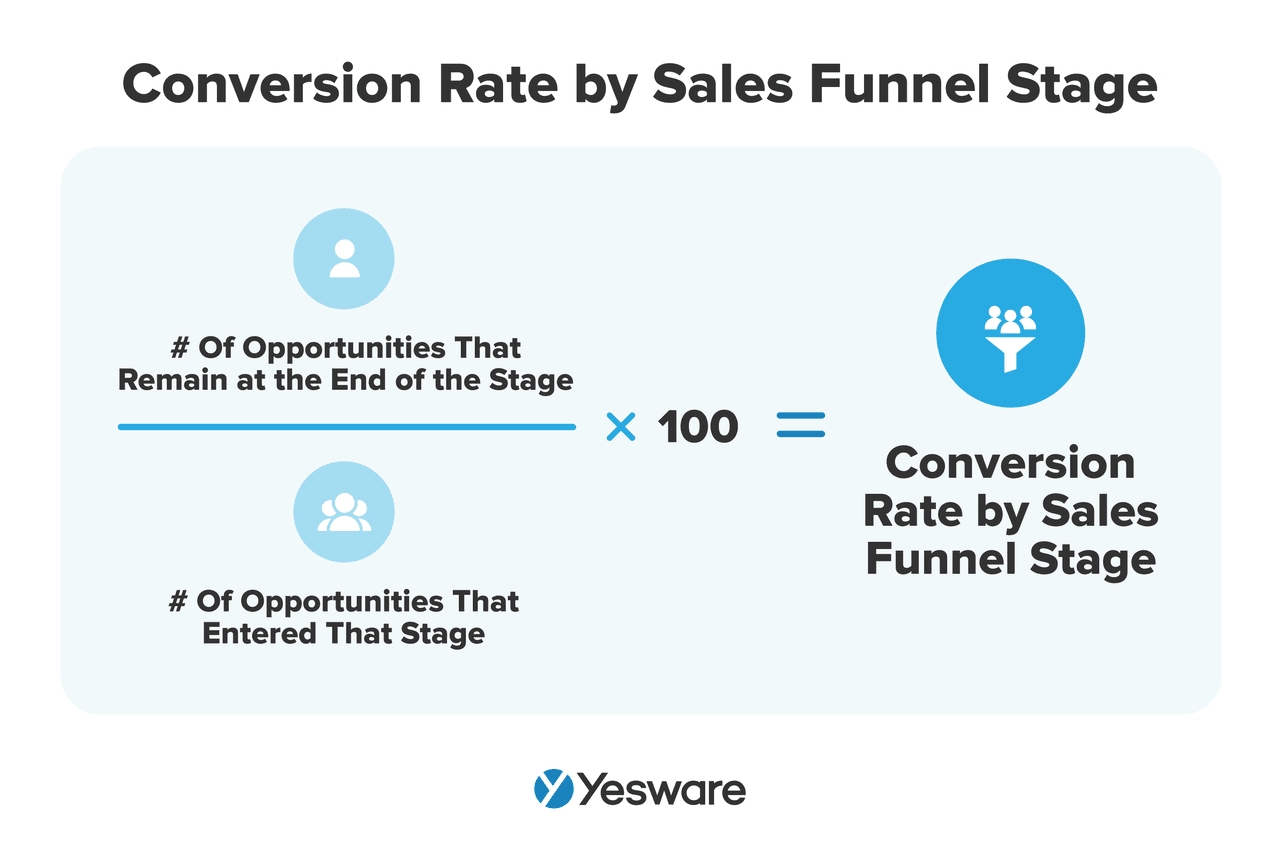 Conversion rate is one of the most important sales metrics to track. It helps sales teams understand the effectiveness of their customer segmenting and outreach campaigns.
Tip: How to convert leads into sales.
Average Deal Size
The average deal size sales metric measures how much revenue, on average, a team generates per sale. 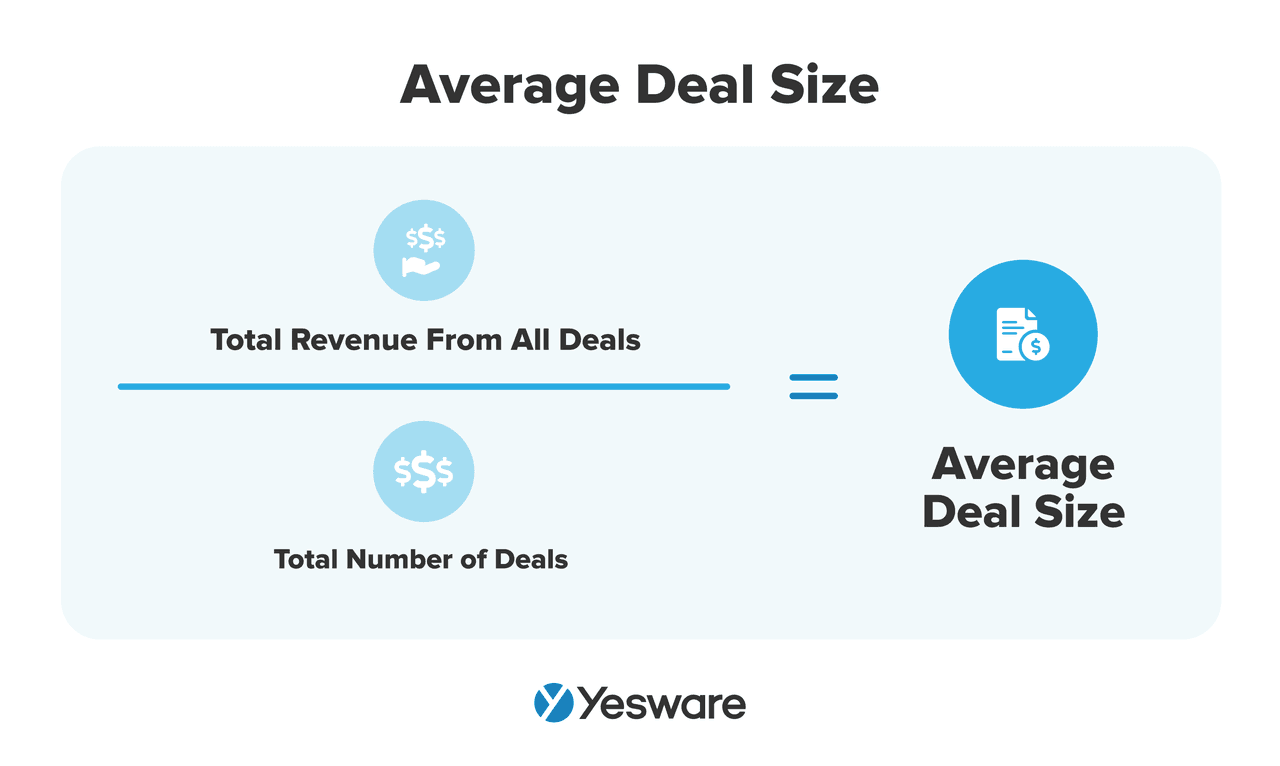 Tracking average deal size is particularly important for sales forecasting.
Sales Cycle Length
One of the most important sales metrics to track is your team’s average sales cycle length, which can directly impact the average conversion rate. 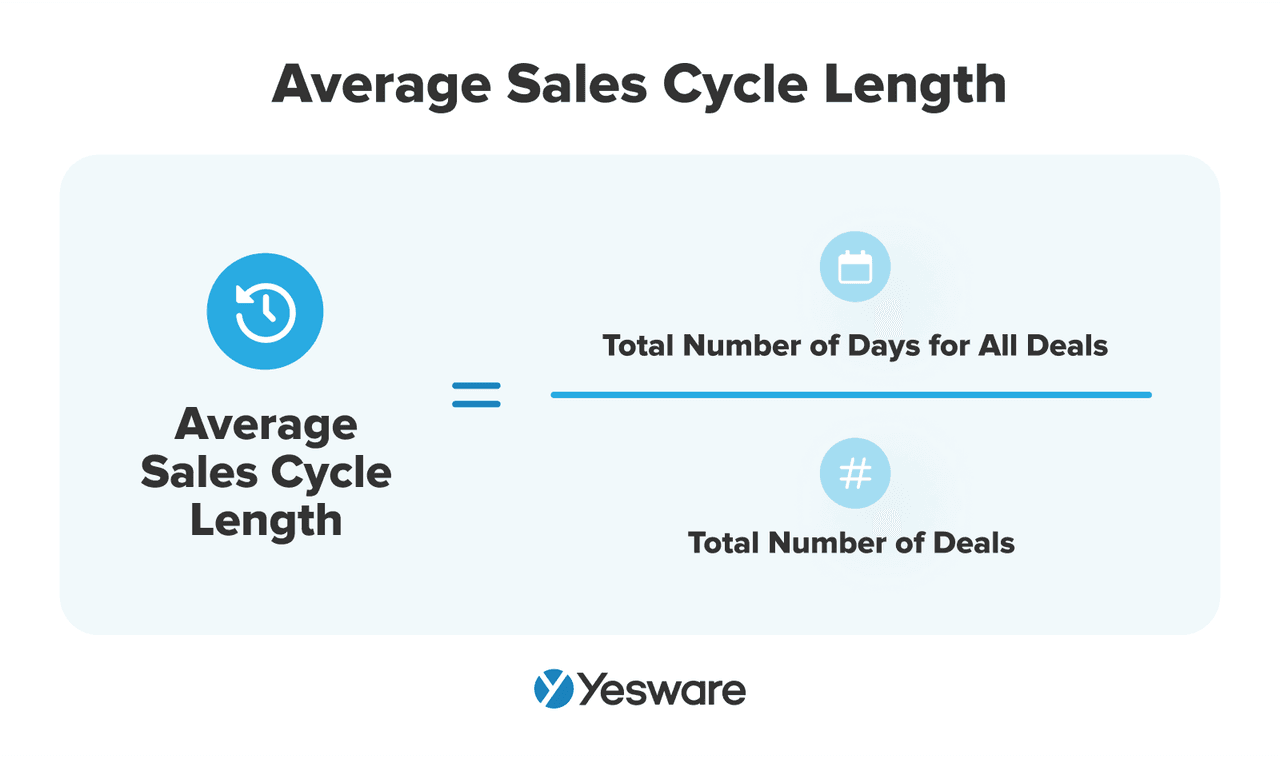 This sales metric represents the amount of time, on average, a closed-won deal spends in the pipeline.
The more optimized your sales cycle, the more deals you can close. While every industry’s benchmarks will differ in regards to an “ideal” average sales cycle length, the goal is to make it as efficient as possible, with no extra steps or delays.
Customer Acquisition Cost (CAC)
Customer acquisition cost (CAC) represents the average amount of money a team invests to convert a new lead into a new customer. 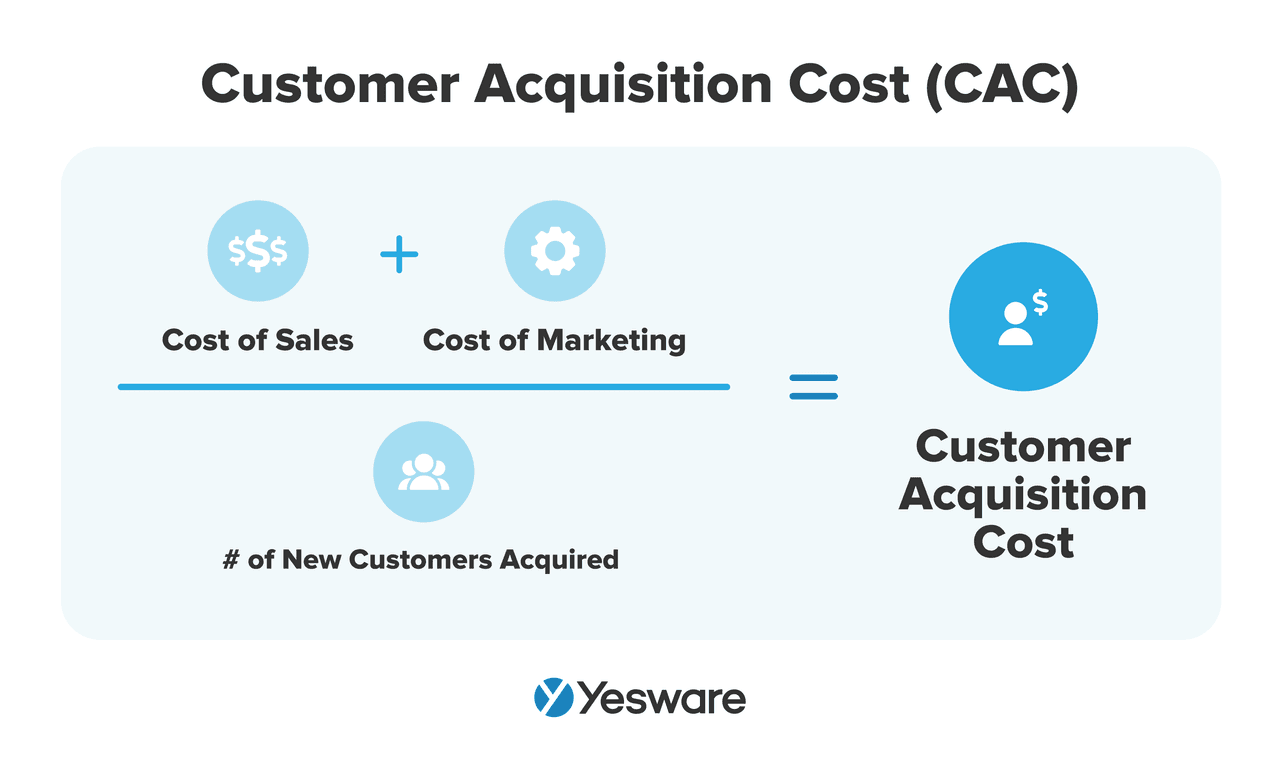 Analyzing CAC can help teams gather insight into the effectiveness of their sales strategies and sales tactics and ensure that their resources are being used as efficiently as possible.
This metric helps teams measure the ROI of their marketing and sales campaigns.
Tools and Techniques for Sales Performance Analysis
Given the importance of analyzing sales performance, many teams rely on specific tools to make the process more insightful, action-oriented and result-oriented.
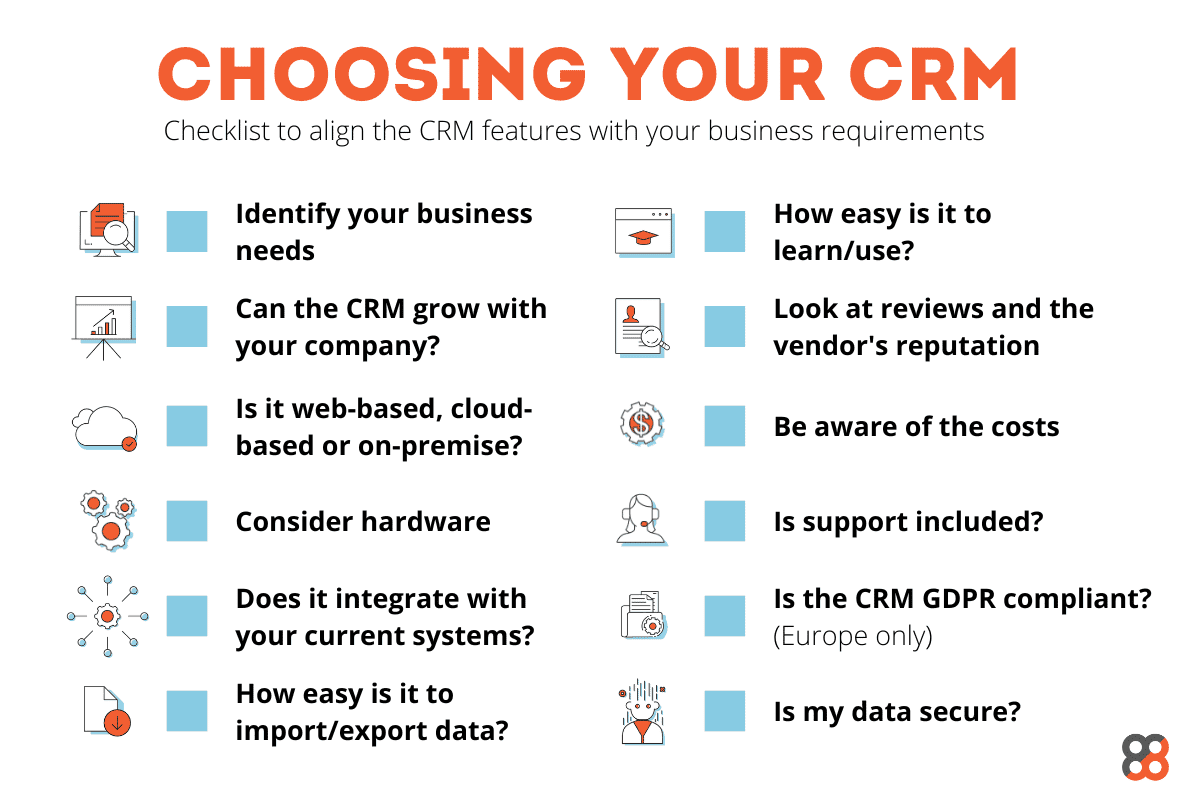
CRM Software
Every sales team needs CRM software for a multitude of reasons—but this tool is especially important when it comes to collecting and organizing sales data, and analyzing sales performance.  Effective CRM implementation has been shown to create a more efficient sales process and improve the customer experience, among other tangible results. And a clearly defined CRM strategy can help sales and marketing teams use this tool to its full potential when it comes time to analyze sales data.
To that end, it’s important that teams choose a CRM platform that’s likely to be adopted and implemented faithfully.
When it comes to sales performance analysis, it’s also important to have a standard process across the team regarding data collection, organization, and analysis.
Sales Dashboards
A sales dashboard is a visual representation of sales data.
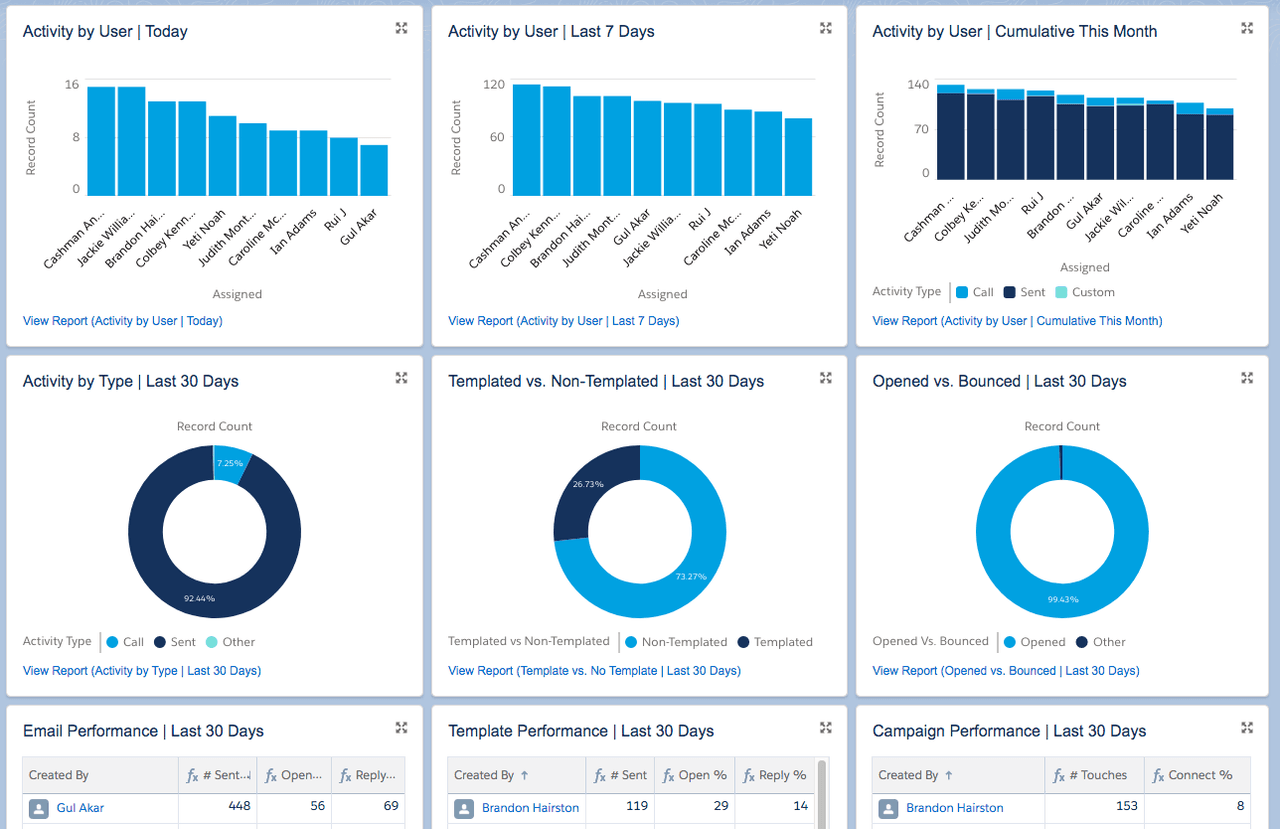
Sales dashboards make sales performance analysis much easier and more tangible, and give reps the chance to see their progress in a visual way.
There are many sales dashboard tools available to help teams analyze their sales data, including some that allow users to customize the way they represent their various data sets.
Not only do sales dashboards help sales teams make better-informed decisions, but they can also be very motivating to sales reps and help improve accountability and team culture.
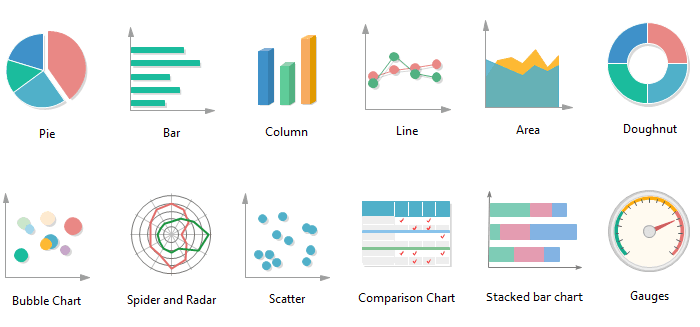
Data Visualization
Even for teams that don’t use dedicated sales dashboard software, it’s important to visualize the sales data in a tangible way in order to analyze sales performance effectively.
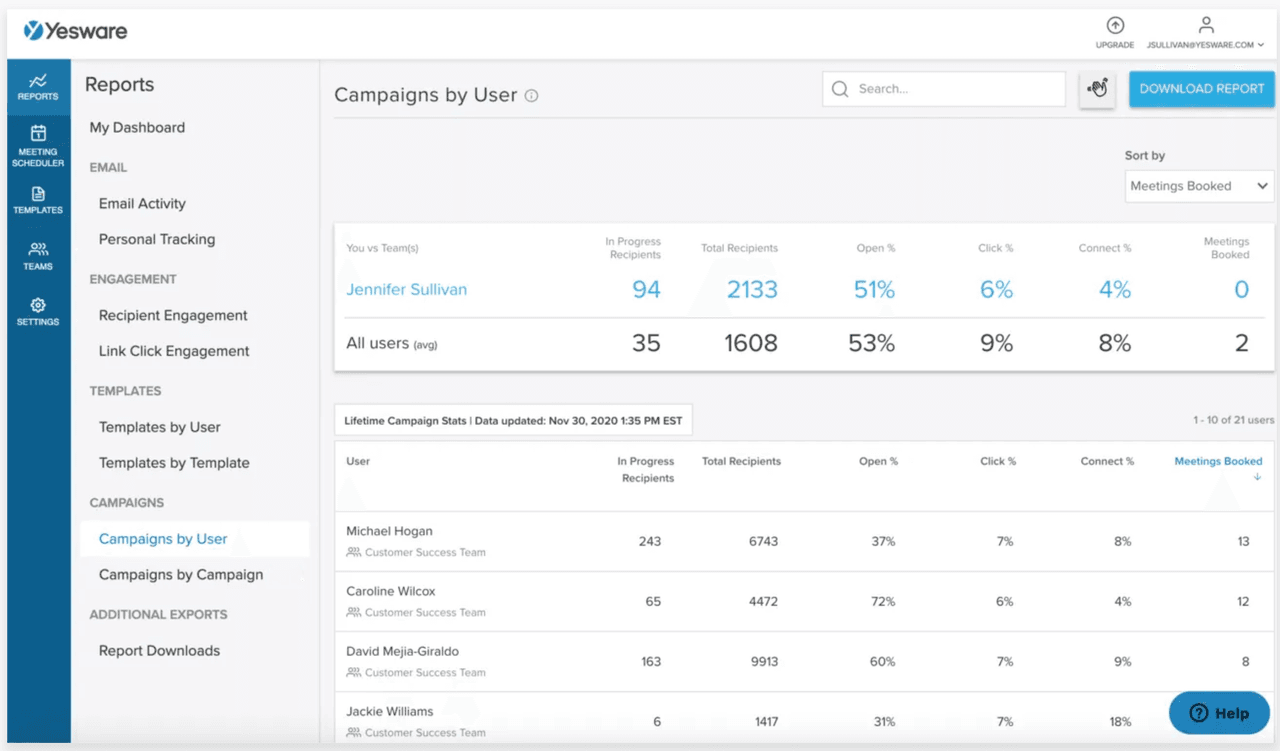
Tip: Yesware allows users to visualize their data in easy-to-read sales reports.
Users can receive quick, actionable insights with Yesware’s reporting, which lives inside their Gmail or Outlook inbox.
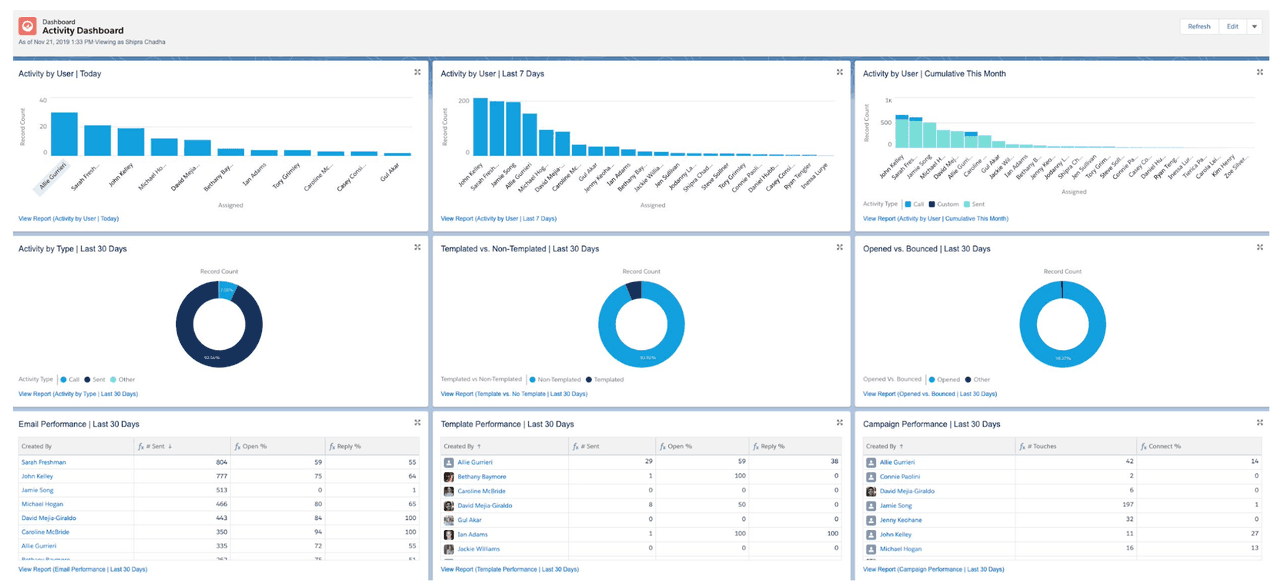
Or, users visualize their data and what’s working across their team using our Salesforce + Yesware integration.
Using charts, graphs, and other data visualization tools can help sales teams reach a more easily reached consensus about sales performance and future sales strategies.
Pro Tip: For guidance on choosing the right tool for your email metrics, check out The 10 Best Free Sales Tracking Software in 2025.
Steps to Conduct a Comprehensive Sales Performance Analysis
Whether your team is brand new to sales performance analysis or already experienced in the practice, the following steps will help you create a reliable, comprehensive process for analyzing your team’s sales data and results.
However you approach this process and however many times your team iterates on it until it’s optimized, it’s important that the entire team follows a unified, standardized approach for each of the following steps.
Data Collection
Data collection is the first step in effective sales performance analysis.
It’s no secret that the sales process generates an outrageous volume of data, from contact information to interaction details to specific SMART sales goal results. 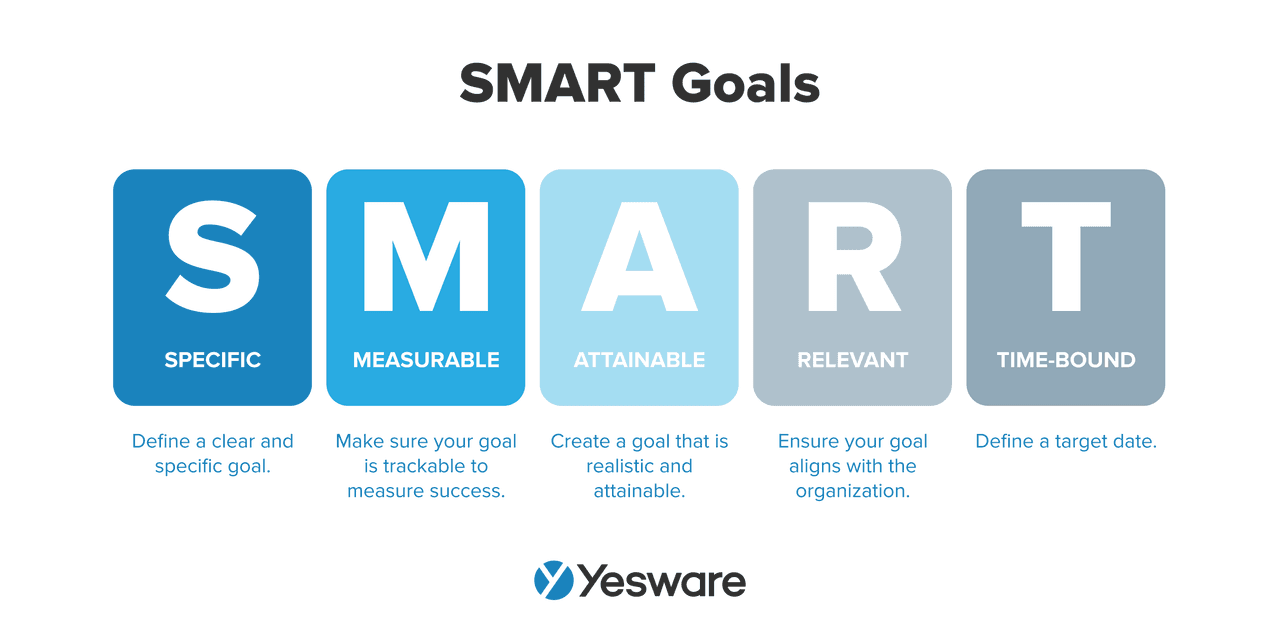 With that in mind, your data collection practices need to be meticulous and carefully structured so that the entire team knows how and when to gather data.
Sales goals, targets, and quotas can help your team determine which sales KPIs, metrics, and data will be most important for your team to collect.
The most important things to keep in mind when it comes to data collection are accuracy and thoroughness. The more complete and up-to-date your data is, the more effective your sales performance analysis can be.
Data Organization
The sheer amount of data that your team will collect makes careful organization a requirement for effective sales performance analysis.
For virtually all teams but the very smallest (who may be able to get by with a sophisticated version of a spreadsheet), data organization is likely a job best reserved for, or at least supported by, sales software.
Your CRM platform is a great start, or there are dedicated sales analytics apps that can help, too.
Regardless of which tools you choose to help manage your data, it’s important to ensure that everyone on the team is on the same page about where and on what schedule they’ll be expected to upload their data.
Data Analysis
Data analysis is the cornerstone of sales performance analysis. This is the process of applying statistical methods and tools to analyze your sales data over a given period of time.
Data analysis can help sales teams identify patterns, trends, and even outliers, which can then help them make data-driven decisions about how to move forward.
It’s important to choose analysis methods that are most effective for your team and the datasets you’re using to understand your performance.
It’s also crucial that you analyze data on a routine, regular basis.
Actionable Insights
After your team analyzes its sales data, it’s time to put that analysis to work. Sales performance analysis is all about translating what you’ve learned from the data into actionable changes that will improve the sales process.
The actionable insights derived from your data should be easy to understand—graphs and other visual representations can make it easy for your entire team to grasp their next strategies and tactics.
However you present the data, though, it’s very important that the results and subsequent strategy updates are communicated to the entire team.
Tip: Looking to leverage sales performance findings from other teams as well? Check out our sales engagement data trends from millions of sales activities across the space.
 Sales Engagement Data Trends from 3+ Million Sales ActivitiesLooking at millions of tracked email activity over the past few years, this ebook is filled with our top studies and findings to help sales teams accelerate results.
Common Challenges in Sales Performance Analysis
Now that we’ve discussed how to analyze sales performance, what are the common challenges of doing so?
Sales performance analysis is important, but it isn’t always easy.
Be aware of the following common challenges in sales performance analysis so your team can work to avoid them.
Data Overload
One of the biggest risks in sales performance analysis is how easy it can be to get completely overwhelmed by the data.
Active sales opportunities can generate new data on a daily and even hourly basis, and it can become quite a challenge to track, store, and gather insight from the sheer volume of what’s constantly available.
Avoid analysis paralysis by getting clear about exactly which data your team needs to make strategic decisions. While it’s still important to collect and keep an eye on a variety of datasets, your team can work to prioritize the most important strands to keep them front and center in the analysis and insight process.
Resistance to Change
For some sales teams, an introduction to sales performance analysis can feel overwhelming. Data-driven decision-making requires thought, effort, and careful attention to detail, and these expectations (on top of a sales rep’s already busy workload) aren’t always met with warm reception.
Sales managers should work to create a culture of continuous learning and improvement, even beyond the implementation of sales performance analysis.
An emphasis on a growth mindset across the sales experience can go a long way in helping the sales team feel comfortable participating in sales performance analysis. 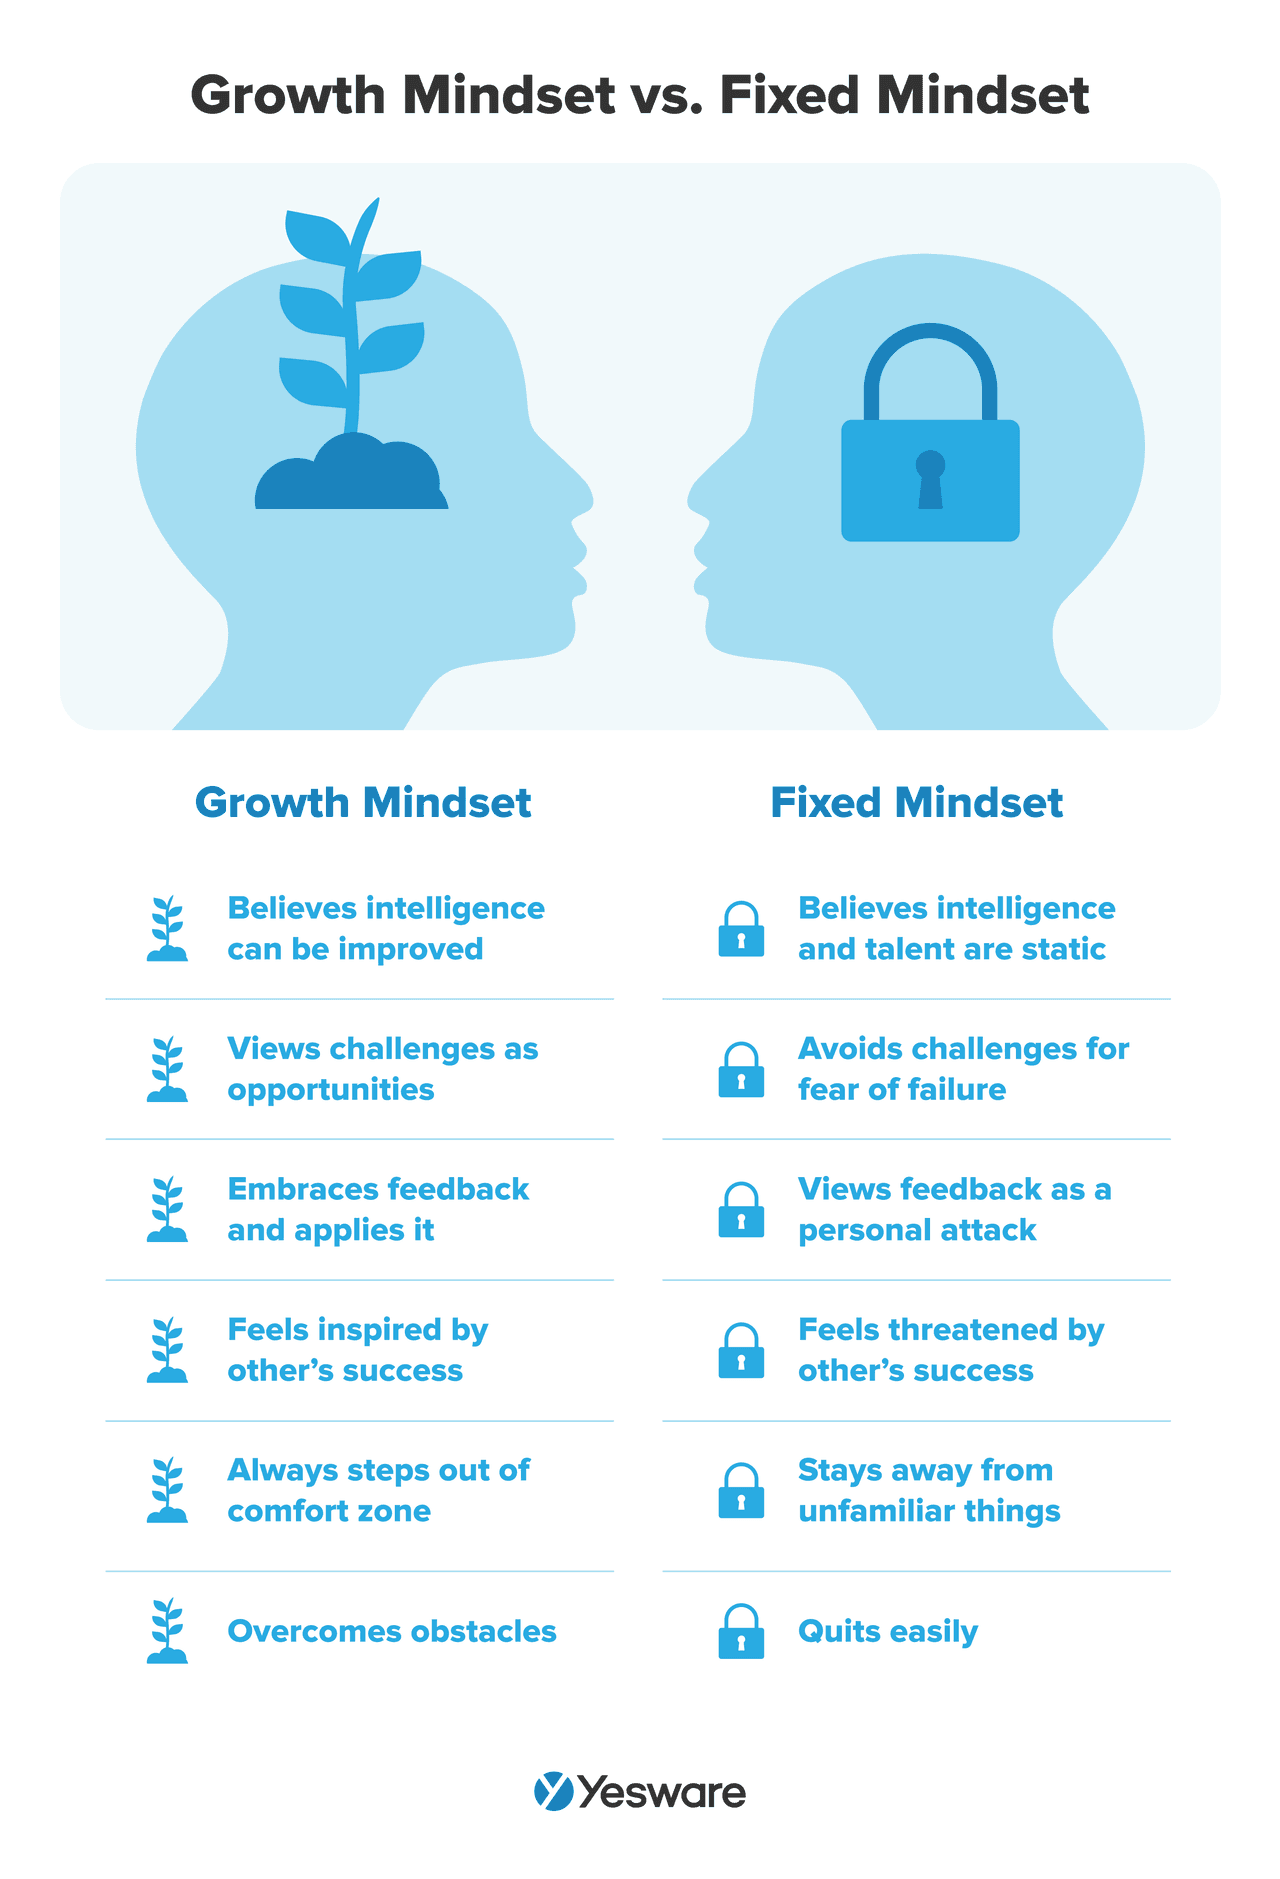
Inconsistent Data
Adding to the challenge of massive amounts of data is the fact that not all of it is reliable. However, in order for sales performance analysis to be reliable, the data that goes into it needs to be accurate and complete.
Fortunately, there are tools on the market built specifically to help with data hygiene.
And many sales performance analysis tools have built-in features that help validate your data inputs.
Conclusion
Regular sales performance can help take your sales team from good to great. The methods and tools discussed in this article on how to analyze sales performance can help your team start or improve your sales performance analysis process.
Yesware’s built-for-sales-teams solutions are designed to help sales professionals make sense of (and take action on) everyday sales data. Our easy-to-read data insights make it easy for sales reps to perform enhanced sales performance analysis.
Get sales tips and strategies delivered straight to your inbox.
Yesware will help you generate more sales right from your inbox. Try our Outlook add-on or Gmail Chrome extension for free, forever!
Related Articles


Casey O'Connor
![Sales Velocity: What It Is + How to Calculate It [Examples]](/blog/_next/image/?url=https%3A%2F%2Fwww.yesware.com%2Fwp-content%2Fuploads%2F2022%2F03%2Fsales-velocity-yesware.jpg&w=1280&q=75)
Casey O'Connor

Casey O'Connor
Sales, deal management, and communication tips for your inbox